| Title: | Regulatory Tables for Clinical Research |
| Version: | 0.4.2 |
| Description: | Creates tables suitable for regulatory agency submission by leveraging the 'gtsummary' package as the back end. Tables can be exported to HTML, Word, PDF and more. Highly customized outputs are available by utilizing existing styling functions from 'gtsummary' as well as custom options designed for regulatory tables. |
| License: | GPL (≥ 3) |
| URL: | https://github.com/shannonpileggi/gtreg, https://shannonpileggi.github.io/gtreg/ |
| BugReports: | https://github.com/shannonpileggi/gtreg/issues |
| Depends: | R (≥ 4.1) |
| Imports: | cli (≥ 3.6.1), dplyr (≥ 1.1.1), forcats (≥ 1.0.0), glue (≥ 1.6.2), gtsummary (≥ 2.1.0), purrr (≥ 1.0.1), rlang (≥ 1.1.1), stringr (≥ 1.5.0), tibble (≥ 3.2.1), tidyr (≥ 1.2.1) |
| Suggests: | covr (≥ 3.6.1), gt (≥ 0.10.0), knitr (≥ 1.43), rmarkdown (≥ 2.22), spelling (≥ 2.2.1), testthat (≥ 3.1.9) |
| VignetteBuilder: | knitr |
| Config/testthat/edition: | 3 |
| Encoding: | UTF-8 |
| Language: | en-US |
| LazyData: | true |
| RoxygenNote: | 7.3.3 |
| NeedsCompilation: | no |
| Packaged: | 2025-11-25 15:26:27 UTC; pileggis |
| Author: | Shannon Pileggi  [aut, cre, cph],
Daniel D. Sjoberg
[aut]
[aut, cre, cph],
Daniel D. Sjoberg
[aut] |
| Maintainer: | Shannon Pileggi <shannon.pileggi@gmail.com> |
| Repository: | CRAN |
| Date/Publication: | 2025-11-25 15:52:06 UTC |
gtreg: Regulatory Tables for Clinical Research
Description
![]()
Creates tables suitable for regulatory agency submission by leveraging the 'gtsummary' package as the back end. Tables can be exported to HTML, Word, PDF and more. Highly customized outputs are available by utilizing existing styling functions from 'gtsummary' as well as custom options designed for regulatory tables.
Author(s)
Maintainer: Shannon Pileggi shannon.pileggi@gmail.com (ORCID) [copyright holder]
Authors:
Daniel D. Sjoberg danield.sjoberg@gmail.com (ORCID)
See Also
Useful links:
Report bugs at https://github.com/shannonpileggi/gtreg/issues
Create a complete and expanded data frame for tabulating adverse events
Description
Returns a data frame that has an observation for each patient in the study,
with combinations for each ID, SOC, and AE. The returned data frame includes
new logical columns "..ae.." and "..soc.." indicating whether that
row should be included when tabulating the AE table. When multiple
AEs of the same type are observed, the AE with the largest by= value
is the observation to be used in the tabulation.
Usage
.complete_ae_data(
  data,
  id,
  ae,
  soc = NULL,
  by = NULL,
  strata = NULL,
  id_df = NULL,
  by_values = NULL,
  missing_text = "Unknown",
  missing_location = "first"
)
Arguments
data |
Data frame |
id |
String variable name of the patient ID |
ae |
String variable name of the adverse event column |
soc |
Optional string variable name of the system organ class column |
by |
Optional string variable to split results by, e.g. report AEs by grade or attribution |
strata |
Optional string variable to stratify results by, e.g. report AEs summaries by treatment group |
id_df |
Optional data frame of complete id values and strata to achieve correct base n for the situation in which not all subjects experience adverse events |
by_values |
Optional vector of complete by values, listed in desired order, to achieve correct table structure for the situation in which an adverse event of a certain grade is not observed for a given soc |
missing_text |
String that will be shown for missing levels of |
missing_location |
location where the column summarizing values with
missing levels |
Value
a tibble
Examples
df_adverse_events %>%
  .complete_ae_data(
    id = "patient_id",
    ae = "adverse_event",
    soc = "system_organ_class",
    by = "grade",
    strata = "trt"
  )
Tabulate Overall Summary
Description
Tabulate Overall Summary
Usage
## S3 method for class 'tbl_ae'
add_overall(x, across = NULL, ...)

## S3 method for class 'tbl_ae_count'
add_overall(x, across = NULL, ...)

## S3 method for class 'tbl_ae_focus'
add_overall(x, across = NULL, ...)
Arguments
x |
Object of class |
across |
Specify the type of overall statistics to include.
|
... |
Not used |
Value
Summary object of same input class
Notes
If the spanning headers are modified prior to the call of add_overall(),
the ordering of the columns may not be correct.
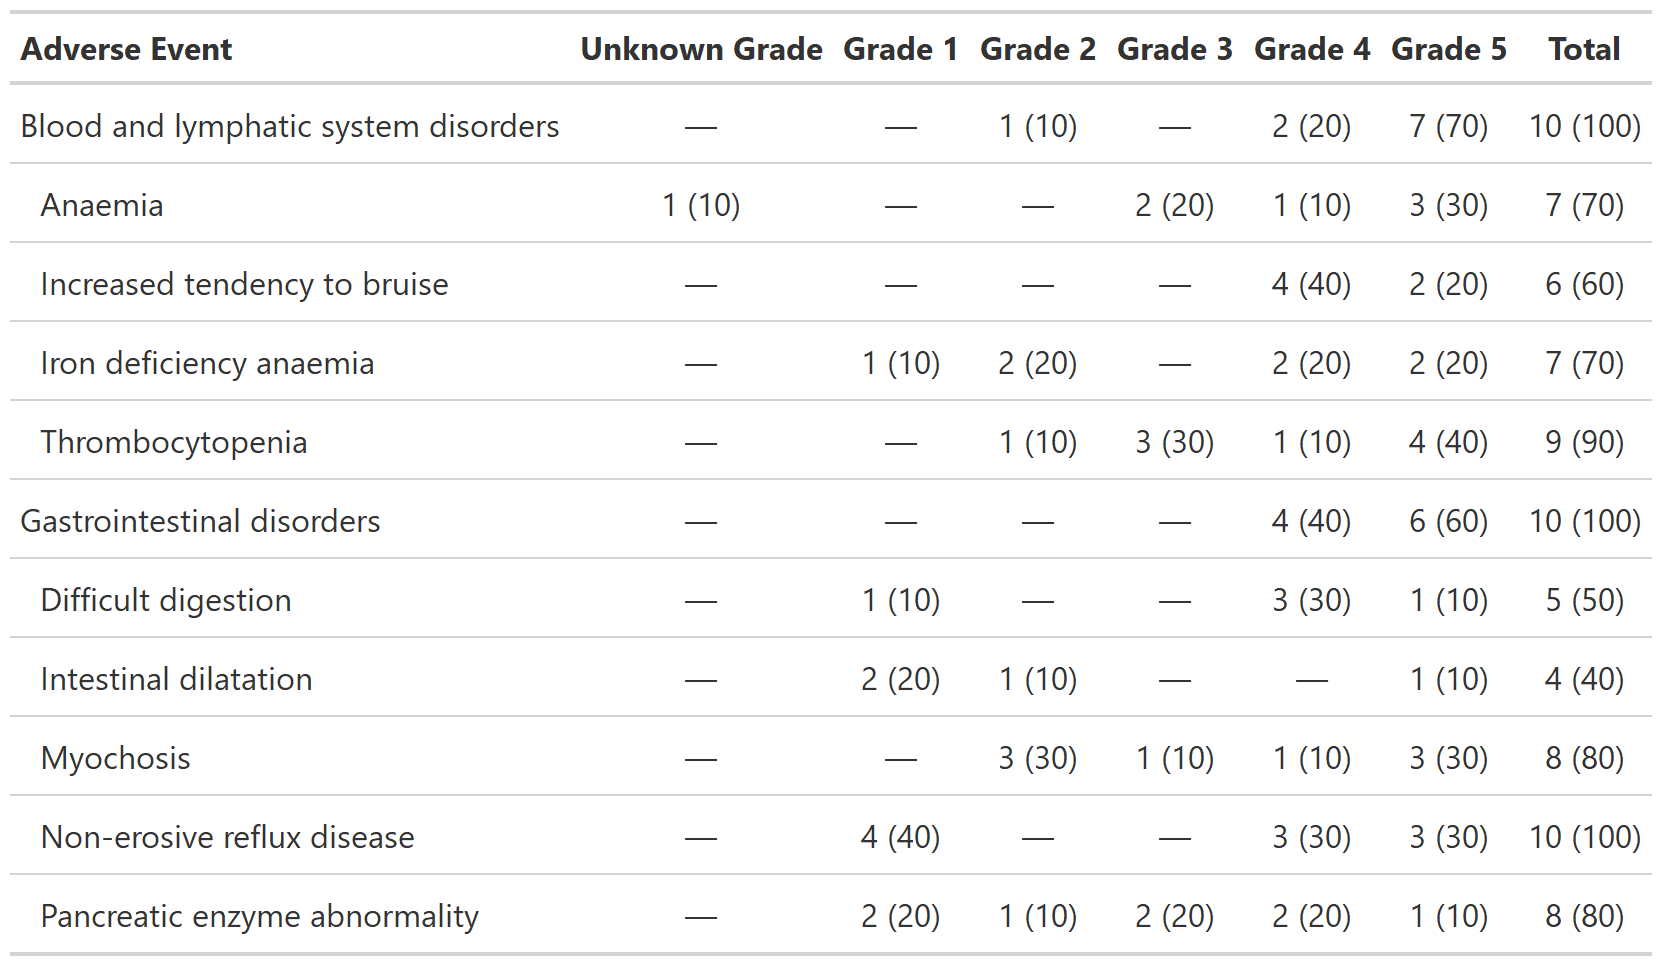
Example Output
Example 1
Example 2
Example 3
Example 4
Examples
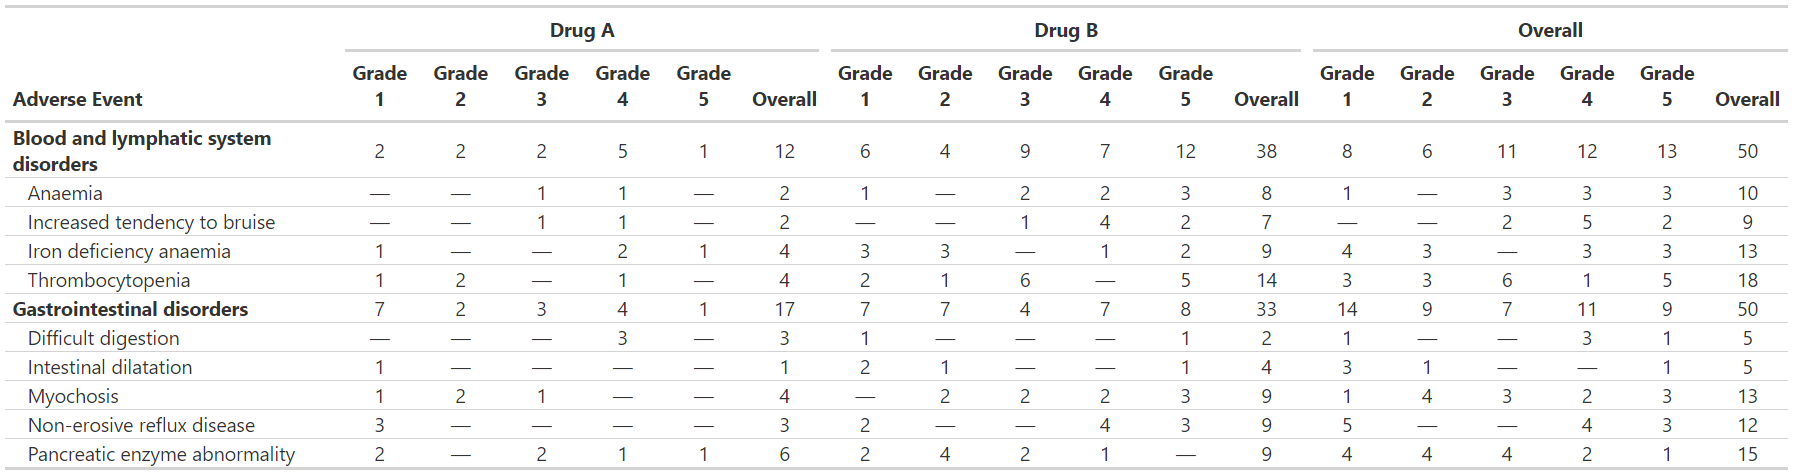
# Example 1 -----------------------------------------------------------------
add_overall_ex1 <-
df_adverse_events %>%
tbl_ae_count(
ae = adverse_event,
soc = system_organ_class,
by = grade,
strata = trt
) %>%
add_overall() %>%
modify_header(all_ae_cols() ~ "**Grade {by}**") %>%
bold_labels()
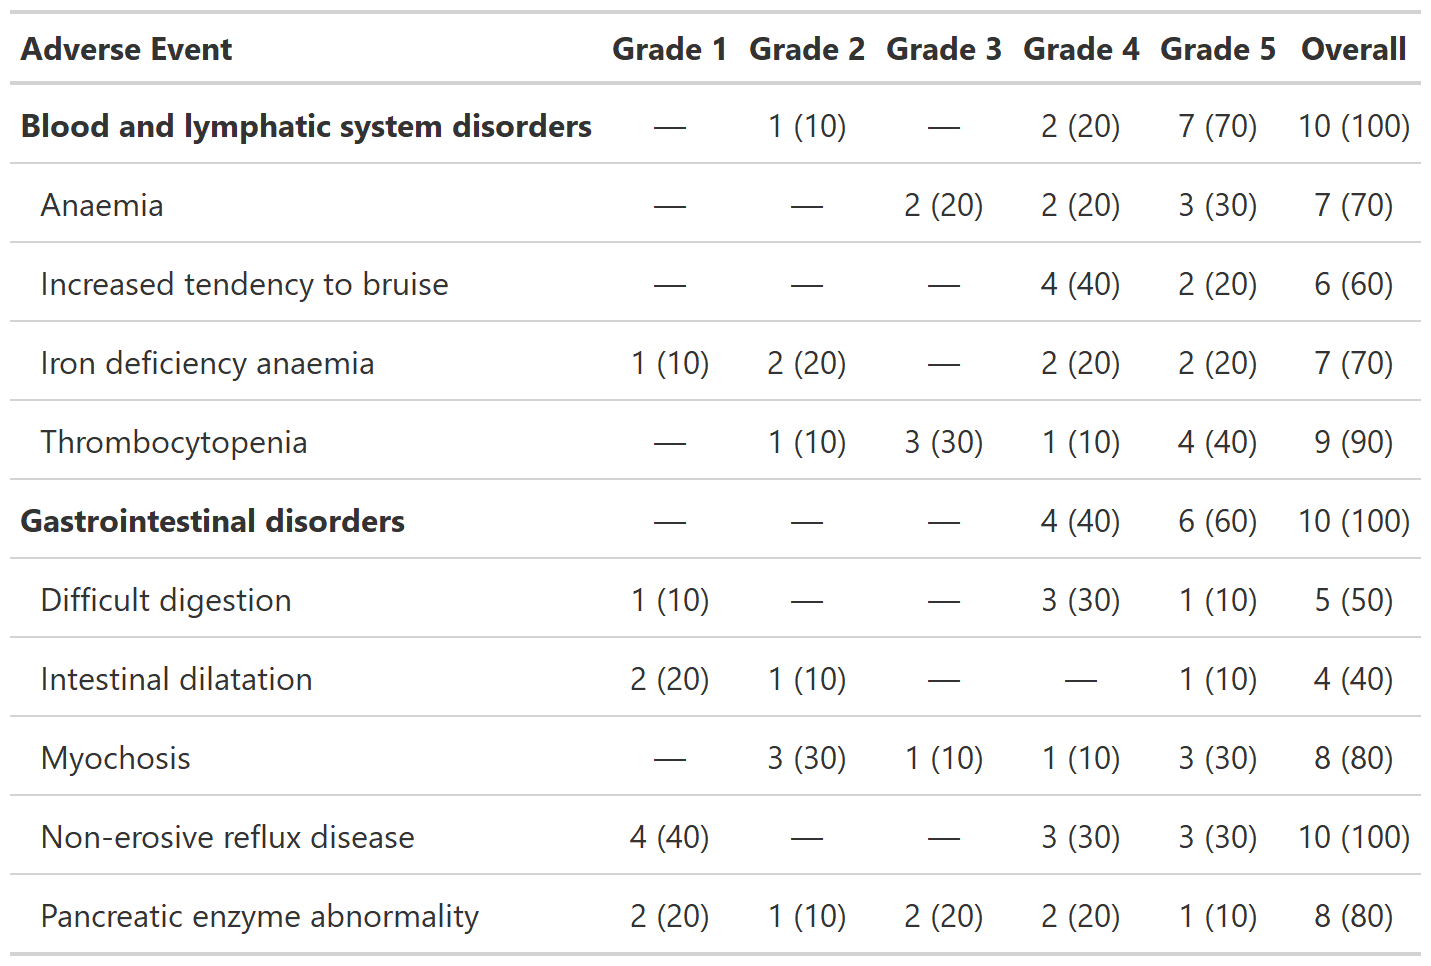
# Example 2 -----------------------------------------------------------------
add_overall_ex2 <-
df_adverse_events %>%
tbl_ae(
id = patient_id,
ae = adverse_event,
soc = system_organ_class,
by = grade
) %>%
add_overall(across = 'by') %>%
modify_header(all_ae_cols() ~ "**Grade {by}**") %>%
bold_labels()
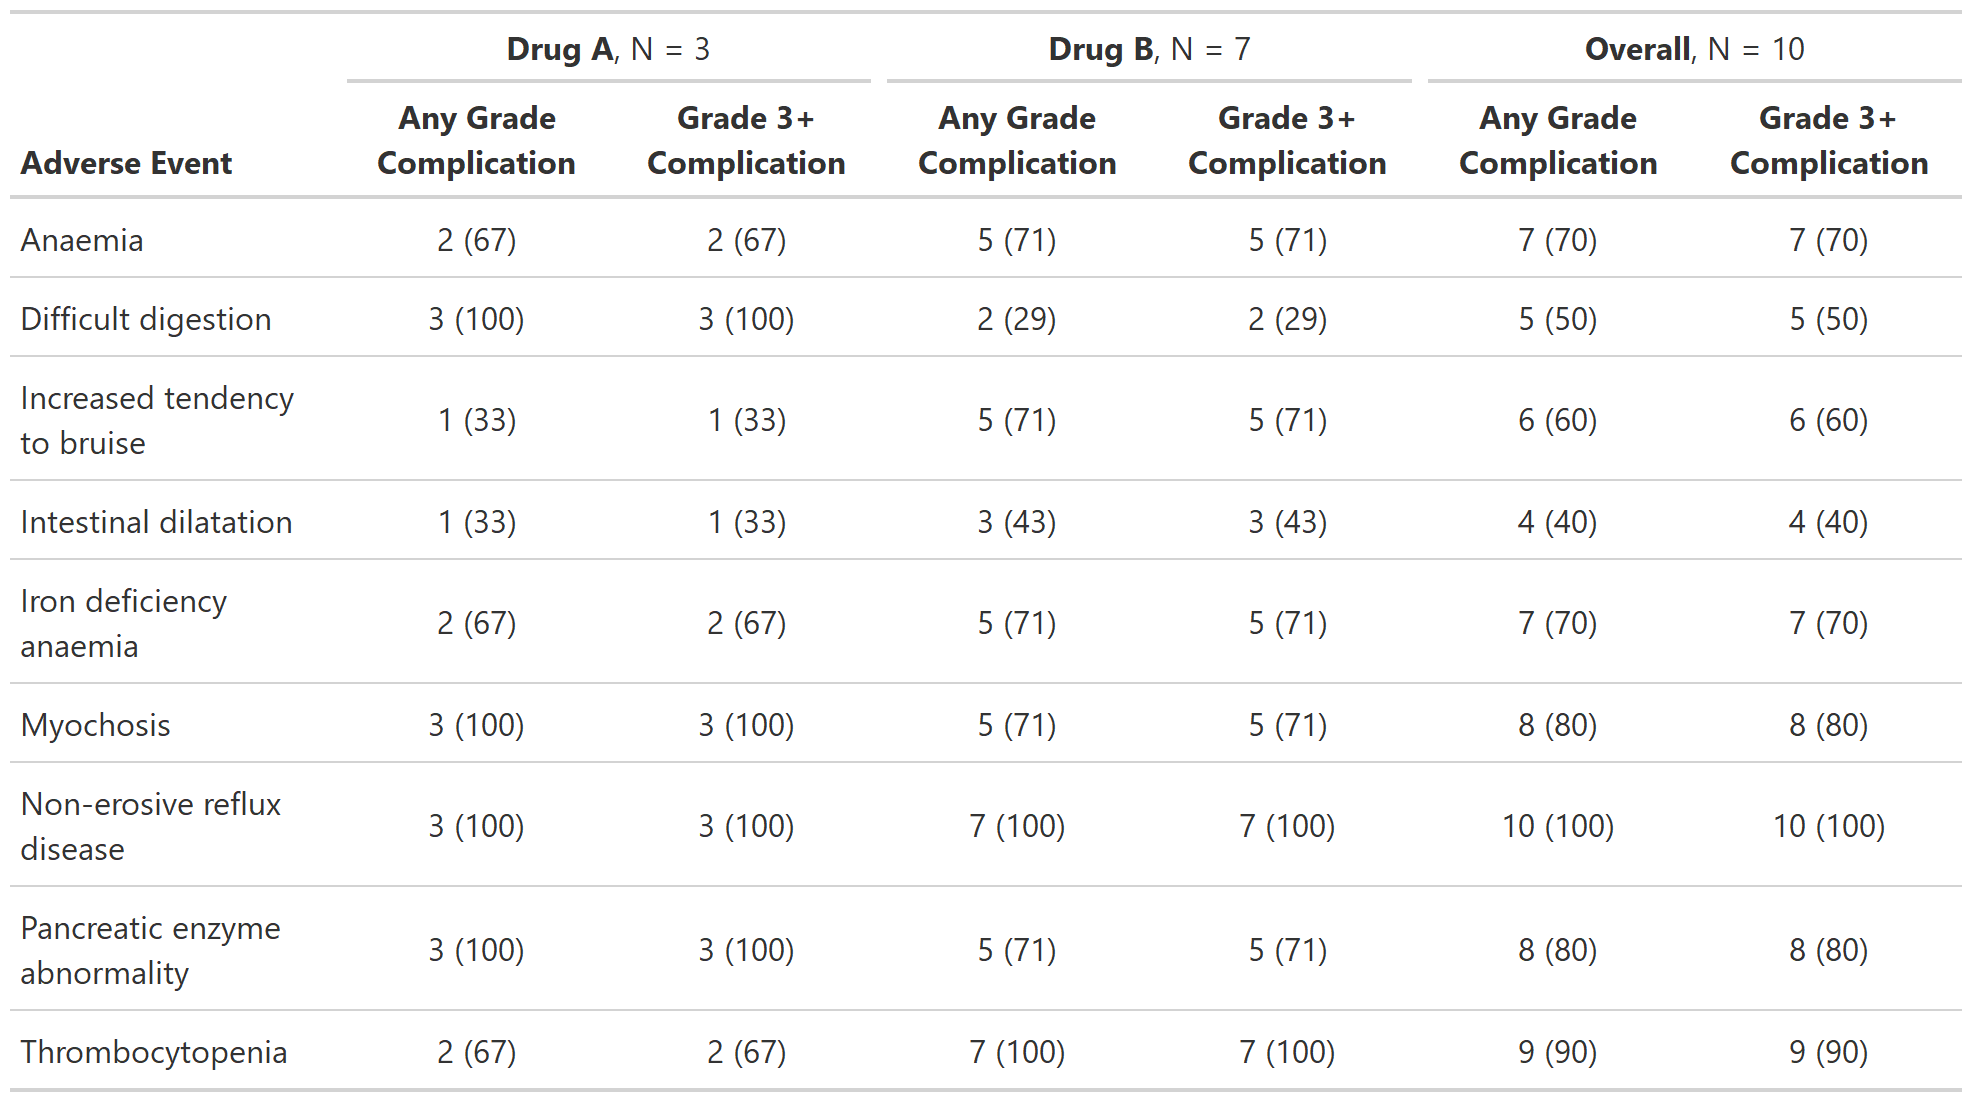
# Example 3 -----------------------------------------------------------------
add_overall_ex3 <-
df_adverse_events %>%
tbl_ae_focus(
id = patient_id,
include = c(any_complication, grade3_complication),
ae = adverse_event,
strata = trt
) %>%
add_overall(across = 'strata')
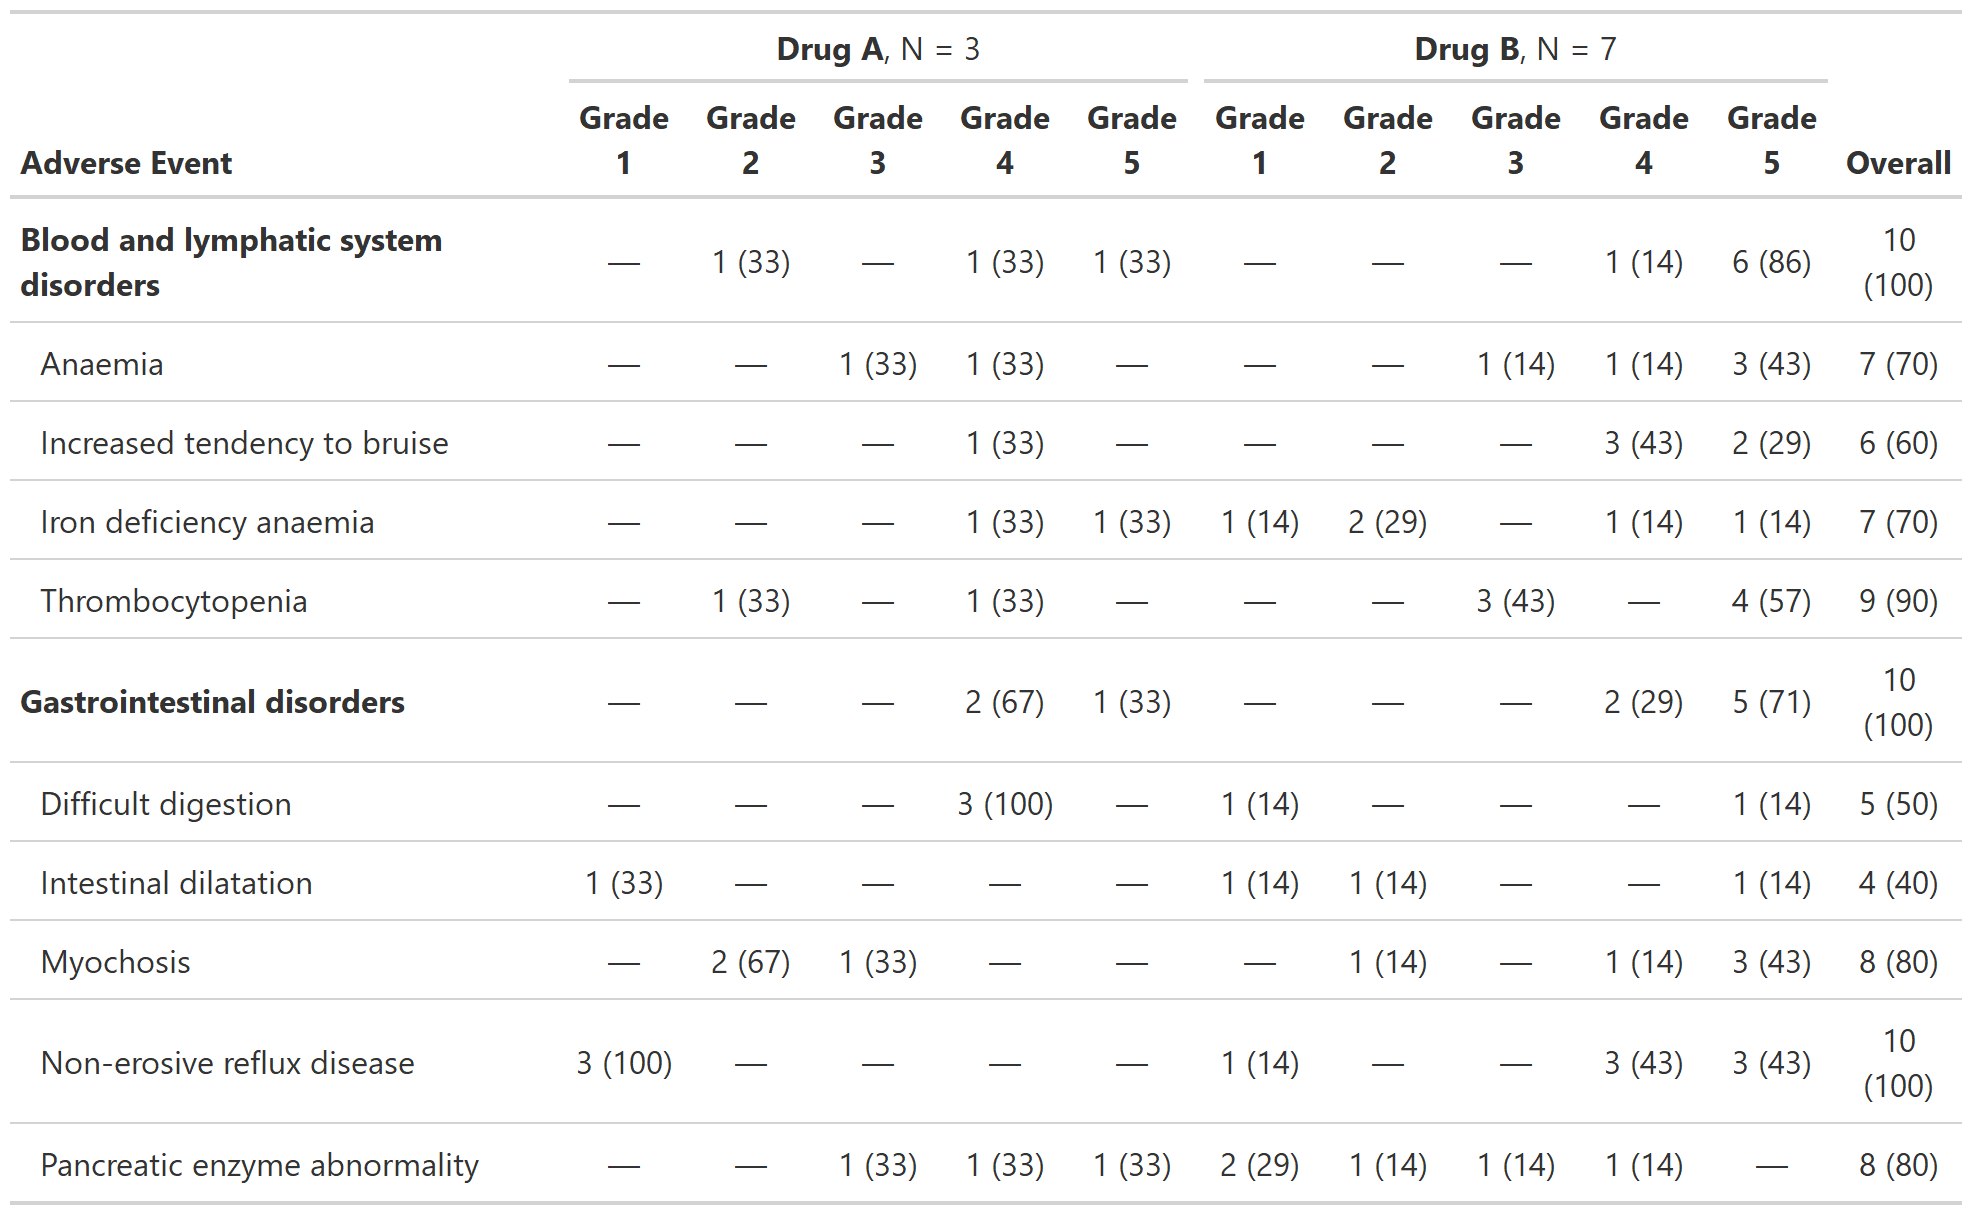
# Example 4 -----------------------------------------------------------------
add_overall_ex4 <-
df_adverse_events %>%
tbl_ae(
id = patient_id,
ae = adverse_event,
soc = system_organ_class,
by = grade,
strata = trt
) %>%
add_overall(across = 'overall-only') %>%
modify_header(all_ae_cols() ~ "**Grade {by}**") %>%
bold_labels()
Simulated Adverse Event Database
Description
A data set containing reported AEs from a trial.
Usage
df_adverse_events
Format
A data frame with 100 rows–one row per patient per AE
- patient_id
Patient ID
- trt
Treatment Group
- system_organ_class
System Organ Class
- adverse_event
Adverse Event
- grade
Grade
- drug_attribution
Drug Attribution
- any_complication
Any Grade Complication
- grade3_complication
Grade 3+ Complication
Simulated Patient Characteristics Database
Description
Simulated Patient Characteristics Database
Usage
df_patient_characteristics
Format
A data frame with 100 rows–one row per patient
- patient_id
Patient ID
- trt
Treatment Group
- age
Patient Age
- marker
Biological Marker
- status
Study Status
- discontinued
Discontinued from Study
- off_trt_ae
Off Treatment Adverse Event
Report Values from gtreg tables in-line
Description
Function allows users to report formatted and styled results from gtreg tables in-line.
Usage
## S3 method for class 'tbl_ae'
inline_text(x, row, column = NULL, ...)

## S3 method for class 'tbl_ae_count'
inline_text(x, row, column = NULL, ...)

## S3 method for class 'tbl_ae_focus'
inline_text(x, row, column = NULL, ...)
Arguments
x |
an object of class |
row |
string indicating the AE or SOC to report |
column |
column name of cell to report. Use |
... |
not used |
Value
string
Examples
tbl <-
  df_adverse_events %>%
  tbl_ae(
    id = patient_id,
    ae = adverse_event,
    soc = system_organ_class,
    by = grade
  )
show_header_names(tbl)

inline_text(tbl, "Anaemia", column = stat_5)
Objects exported from other packages
Description
These objects are imported from other packages. Follow the links below to see their documentation.
- dplyr
%>%,all_of,any_of,contains,ends_with,everything,last_col,matches,num_range,one_of,select,starts_with,vars,where- gtsummary
add_overall,all_categorical,all_continuous,all_continuous2,all_stat_cols,as_flex_table,as_gt,as_hux_table,as_hux_xlsx,as_kable,as_kable_extra,bold_labels,bold_labels,bold_levels,inline_text,italicize_labels,italicize_labels,modify_caption,modify_column_indent,modify_footnote,modify_header,modify_spanning_header,show_header_names,style_number,style_percent,style_sigfig- tibble
Column Selectors
Description
See the Table modifications article for examples.
-
all_ae_cols(overall, unknown)selects all columns summarizing AE statistics. By default, unknown and overall columns are not selected. -
all_cols_in_strata(strata)selects all columns from specified stratum. -
all_overall_cols()selects all overall columns -
all_unknown_cols()selects all unknown columns
Usage
all_ae_cols(overall = FALSE, unknown = FALSE)

all_cols_in_strata(strata)

all_overall_cols()

all_unknown_cols()
Arguments
overall |
logical indicating whether to include the overall columns. Default is FALSE |
unknown |
logical indicating whether to include the unknown or missing columns. Default is FALSE |
strata |
character vector of the selected stratum |
Value
selected columns
Example Output
Example 1
See Also
gtsummary::all_stat_cols()
Examples
selectors_ex1 <-
  df_adverse_events %>%
  dplyr::mutate(grade = ifelse(dplyr::row_number() == 1L, NA, grade)) %>%
  tbl_ae(
    id = patient_id,
    ae = adverse_event,
    soc = system_organ_class,
    by = grade
  ) %>%
  add_overall(across = 'by') %>%
  modify_header(
    all_ae_cols() ~ "**Grade {by}**",
    all_overall_cols() ~ "**Total**",
    all_unknown_cols() ~ "**Unknown Grade**"
  )
Style numbers as x's
Description
The purpose of style_xxx() is to convert numeric values in
summary tables to x's of consistent length for mock tables.
See the Table shells vignette
for detailed examples.
Usage
style_xxx(x, width = digits + 2, digits = 0)
Arguments
x |
a numeric or character vector |
width |
the width of output field of x's, including the decimal place |
digits |
the number of digits displayed after the decimal place |
Value
a character vector
Examples
style_xxx(7:10, digits = 0)
style_xxx(7:10, digits = 1)
style_xxx(7:10, width = 2, digits = 0)
style_xxx(7:10, width = 5, digits = 2)
Tabulate Adverse Events
Description
The function tabulates adverse events. One AE per ID will be counted in the
resulting table. If a by= variable is passed and a
patient experienced more than one of the same AE, the AE associated with the
highest by= level will be included. For example, if a patient has two of
the same AE and by = grade, the AE with the highest grade will be
included.
Similarly, if tabulations within system organ class are requested, the
AE within SOC associated with the highest grade will be tabulated.
Usage
tbl_ae(
  data,
  id,
  ae,
  soc = NULL,
  by = NULL,
  strata = NULL,
  id_df = NULL,
  statistic = "{n} ({p})",
  by_values = NULL,
  digits = NULL,
  sort = NULL,
  zero_symbol = "\U2014",
  missing_location = c("first", "last", "hide")
)
Arguments
data |
Data frame |
id |
Variable name of the patient ID |
ae |
Variable name of the adverse event column |
soc |
Variable name of the system organ class column |
by |
Variable to split results by, e.g. report AEs by grade |
strata |
Variable to stratify results by, e.g. report AEs summaries by treatment group |
id_df |
Optional data frame of complete id values and strata to achieve correct
base n for the situation in which not all subjects experience adverse events. See
|
statistic |
String indicating the statistics that will be reported.
The default is |
by_values |
Optional vector of complete by values, listed in desired order, to achieve correct table structure for the situation in which an adverse event of a certain grade is not observed for a given soc |
digits |
Specifies the number of decimal places to round the summary statistics.
By default integers are shown to zero decimal places, and percentages are
formatted with |
sort |
Controls order of AEs and SOCs in output table.
The default is |
zero_symbol |
String used to represent cells with zero counts. Default
is the em-dash ( |
missing_location |
location where the column summarizing values with
missing levels |
Value
a 'tbl_ae' object
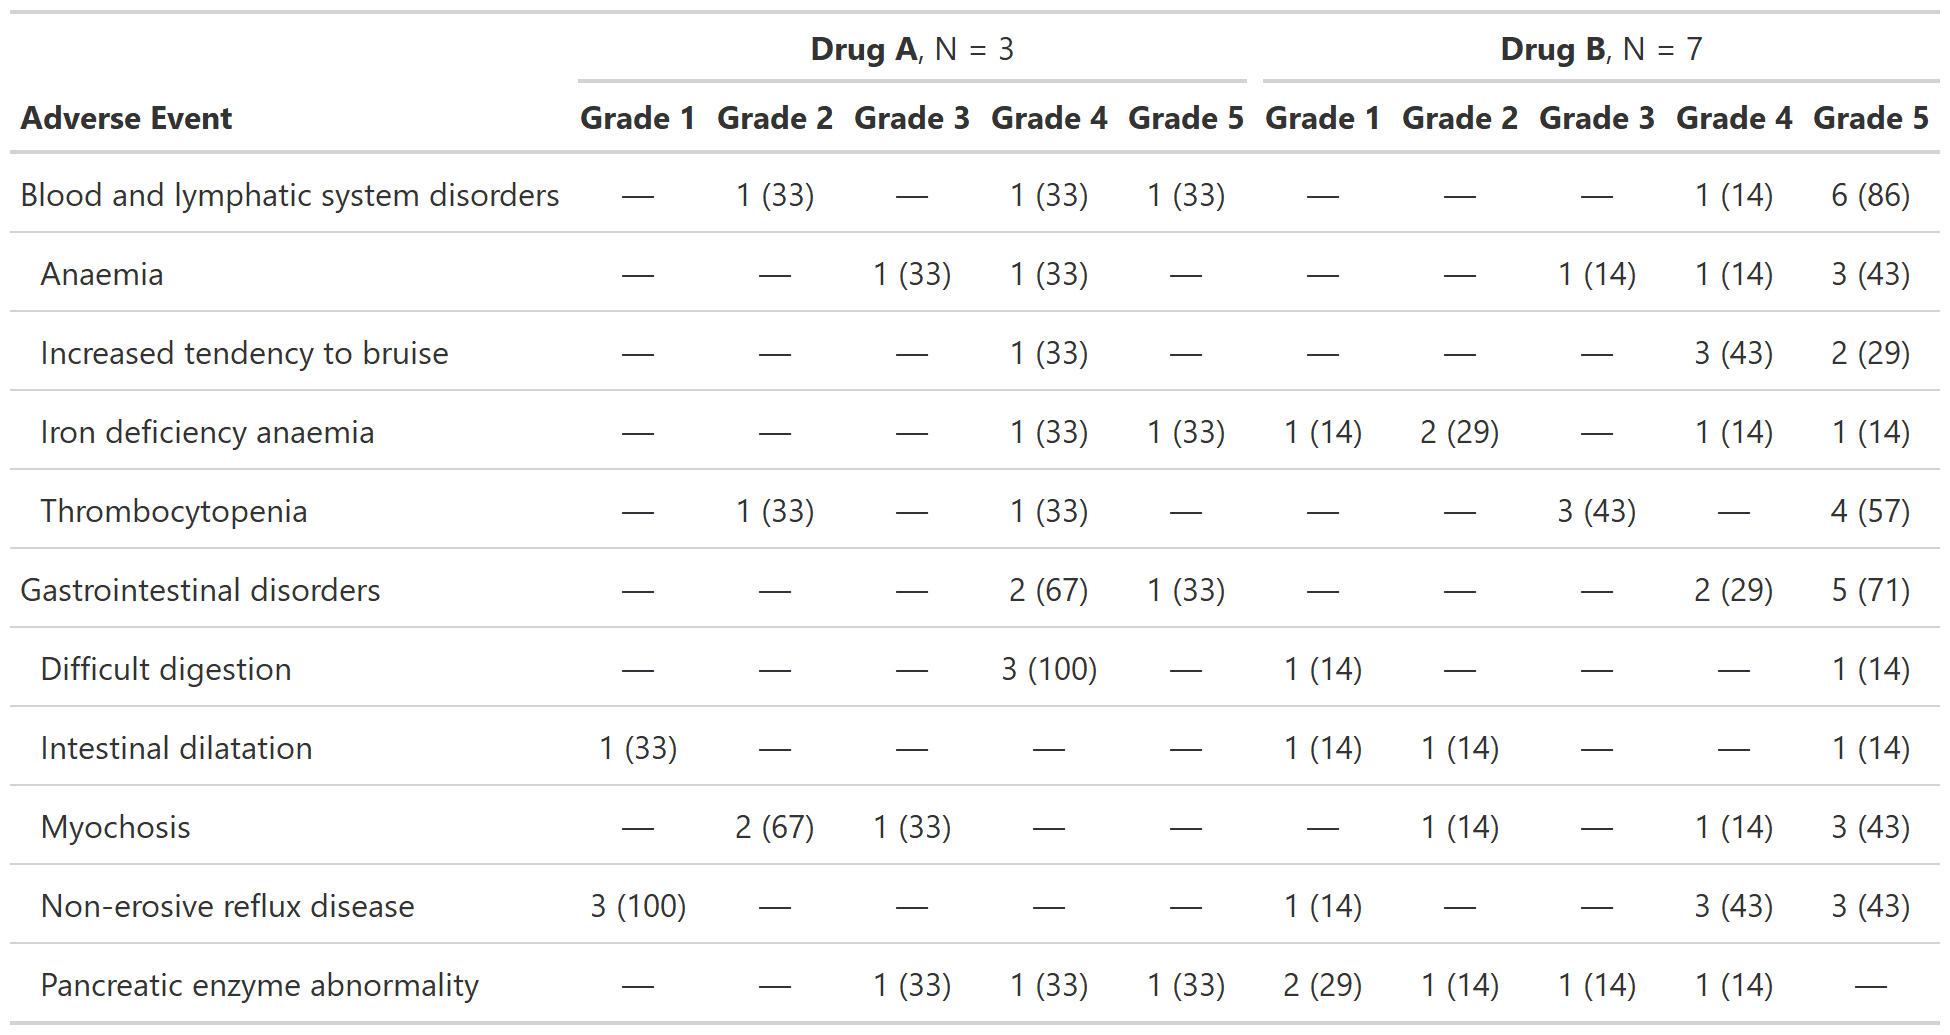
Example Output
Example 1
Example 2
Examples
# Example 1 -----------------------------------------------------------------
tbl_ae_ex1 <-
df_adverse_events %>%
tbl_ae(
id = patient_id,
ae = adverse_event,
soc = system_organ_class,
by = grade,
strata = trt
) %>%
modify_header(all_ae_cols() ~ "**Grade {by}**")
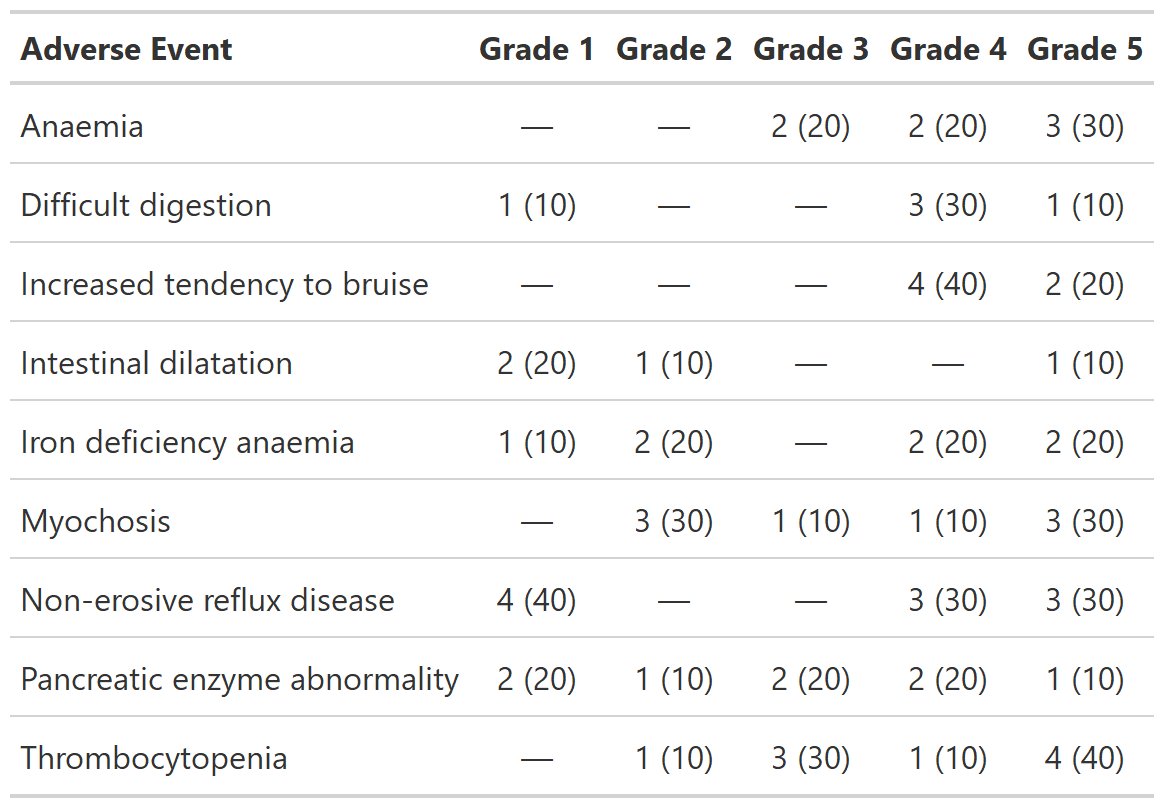
# Example 2 -----------------------------------------------------------------
tbl_ae_ex2 <-
df_adverse_events %>%
tbl_ae(
id = patient_id,
ae = adverse_event,
by = grade
) %>%
modify_header(all_ae_cols() ~ "**Grade {by}**")
Tabulate Raw AE Counts
Description
Create a table counting all AEs.
Usage
tbl_ae_count(
  data,
  ae,
  soc = NULL,
  by = NULL,
  strata = NULL,
  by_values = NULL,
  digits = NULL,
  sort = NULL,
  zero_symbol = "\U2014",
  missing_location = c("first", "last", "hide")
)
Arguments
data |
Data frame |
ae |
Variable name of the adverse event column |
soc |
Variable name of the system organ class column |
by |
Variable to split results by, e.g. report AEs by grade |
strata |
Variable to stratify results by, e.g. report AEs summaries by treatment group |
by_values |
Optional vector of complete by values, listed in desired order, to achieve correct table structure for the situation in which an adverse event of a certain grade is not observed for a given soc |
digits |
Specifies the number of decimal places to round the summary statistics.
By default integers are shown to zero decimal places, and percentages are
formatted with |
sort |
Controls order of AEs and SOCs in output table.
The default is |
zero_symbol |
String used to represent cells with zero counts. Default
is the em-dash ( |
missing_location |
location where the column summarizing values with
missing levels |
Details
tbl_ae_count counts all AEs (whereas tbl_ae
counts by maximum grade). Thus, tbl_ae_count does
not provide percentages as multiple AEs can be counted per subject.
Value
a 'tbl_ae_count' object
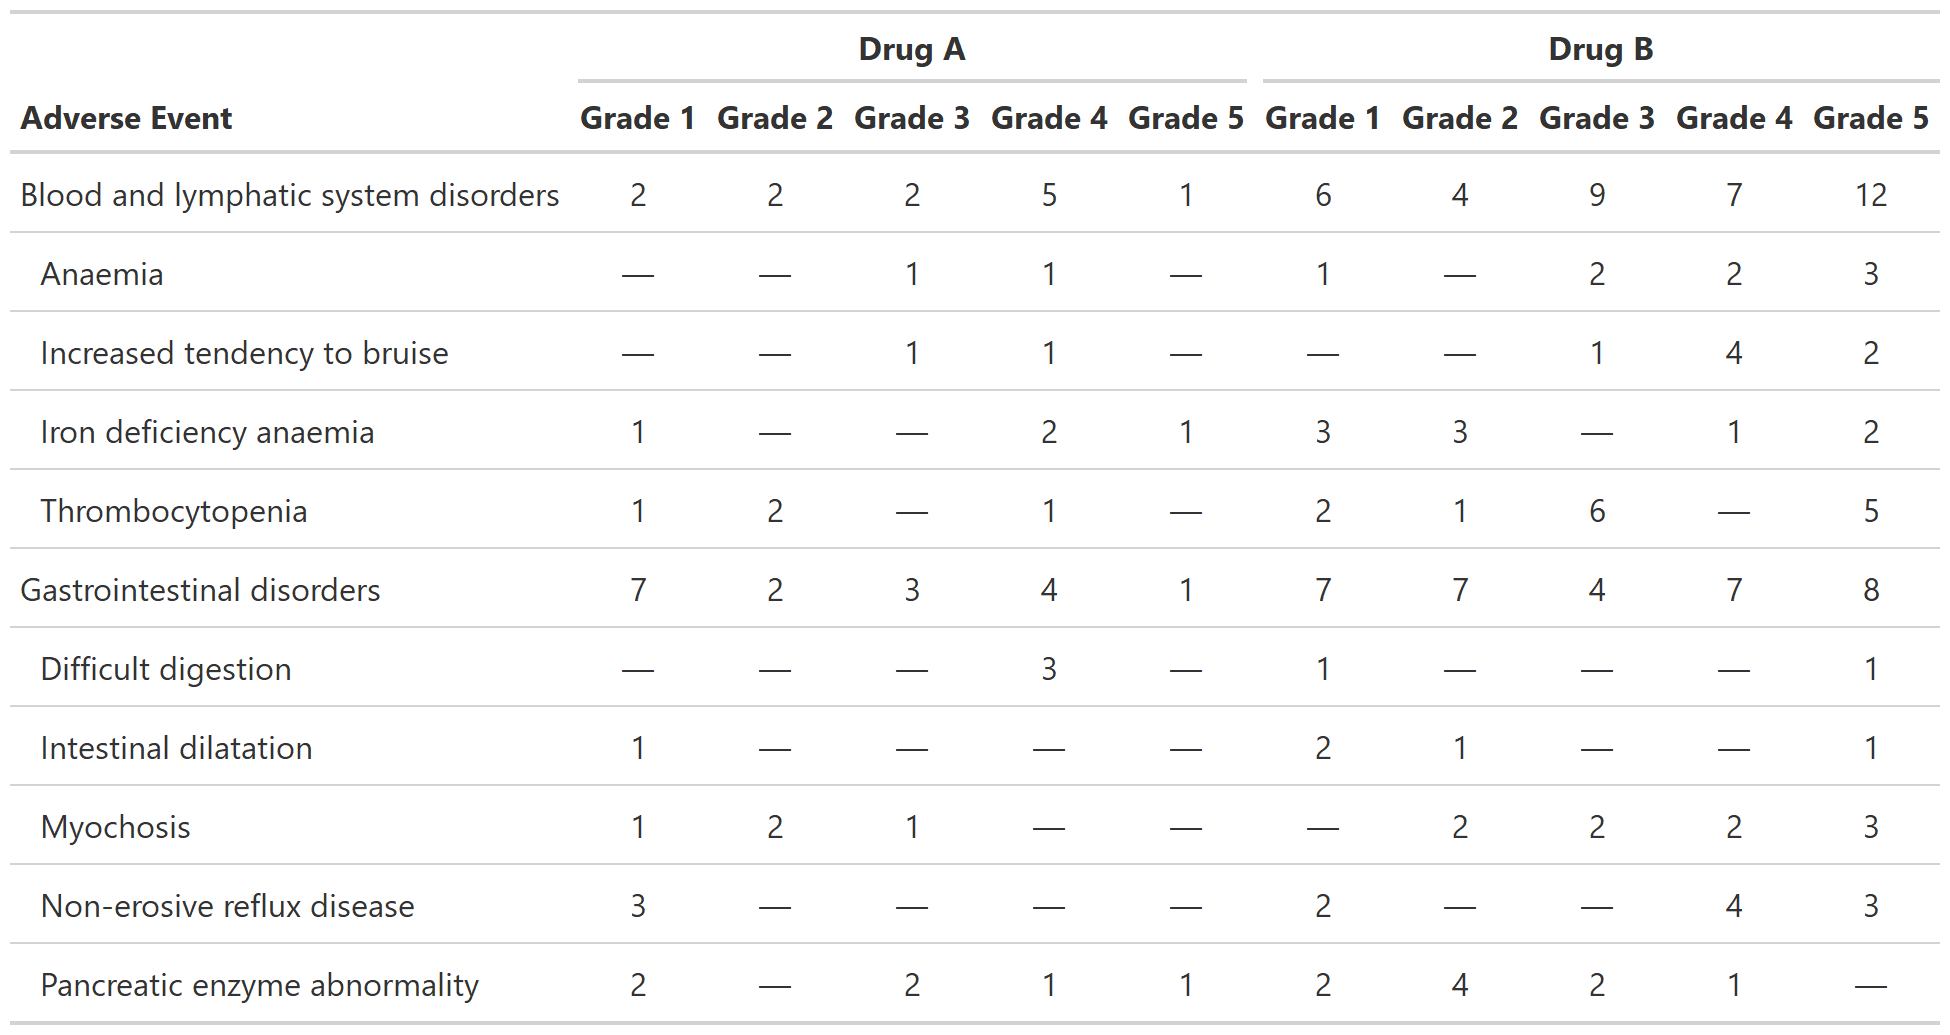
Example Output
Example 1
See Also
Examples
# Example 1 -----------------------------------------------------------------
tbl_ae_count_ex1 <-
  tbl_ae_count(
    data = df_adverse_events,
    ae = adverse_event,
    soc = system_organ_class,
    strata = trt,
    by = grade
  ) %>%
  modify_header(all_ae_cols() ~ "**Grade {by}**")
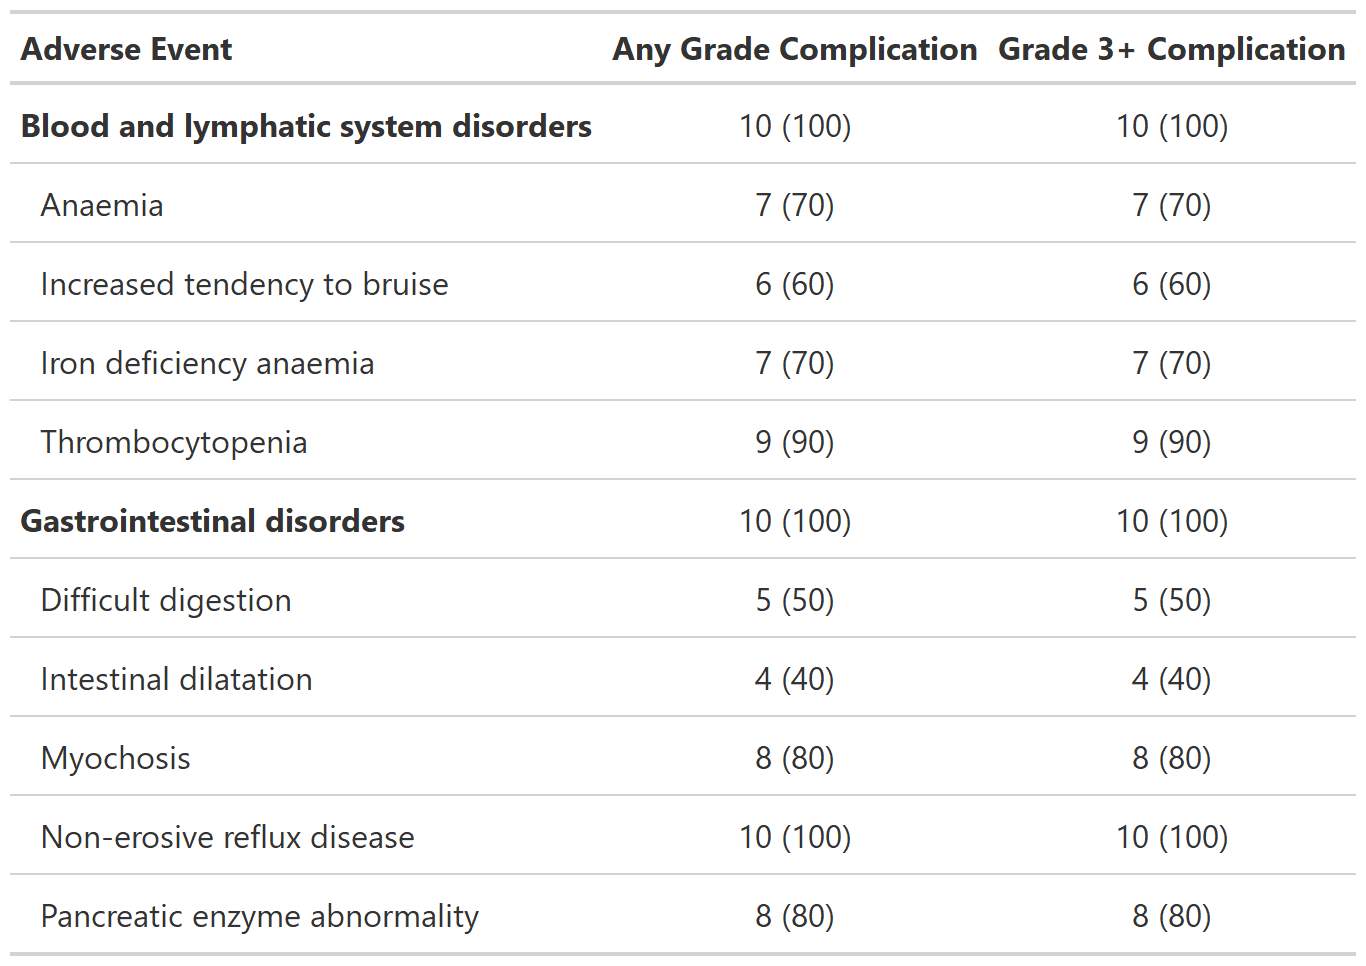
Tabulate AE Focused (Dichotomous) Summaries
Description
Summarize dichotomous AE data. For example, report the rate of patients that have an AE of Grade 3 or higher.
Usage
tbl_ae_focus(
  data,
  include,
  id,
  ae,
  soc = NULL,
  strata = NULL,
  label = NULL,
  id_df = NULL,
  statistic = "{n} ({p})",
  digits = NULL,
  sort = NULL,
  zero_symbol = "\U2014"
)
Arguments
data |
Data frame |
include |
Vector of column names to summarize. Column names may be quoted or unquoted. All columns must be class 'logical'. |
id |
Variable name of the patient ID |
ae |
Variable name of the adverse event column |
soc |
Variable name of the system organ class column |
strata |
Variable to stratify results by, e.g. report AEs summaries by treatment group |
label |
A named list of labels that will be applied in the
resulting table. Names must be those passed in |
id_df |
Optional data frame of complete id values and strata to achieve correct
base n for the situation in which not all subjects experience adverse events. See
|
statistic |
String indicating the statistics that will be reported.
The default is |
digits |
Specifies the number of decimal places to round the summary statistics.
By default integers are shown to zero decimal places, and percentages are
formatted with |
sort |
Controls order of AEs and SOCs in output table.
The default is |
zero_symbol |
String used to represent cells with zero counts. Default
is the em-dash ( |
Value
a 'tbl_ae_focus' object
Example Output
Example 1
Examples
# Example 1 -----------------------------------------------------------------
tbl_ae_focus_ex1 <-
  df_adverse_events %>%
  tbl_ae_focus(
    include = c(any_complication, grade3_complication),
    id = patient_id,
    ae = adverse_event,
    soc = system_organ_class,
    label =
      list(any_complication = "Any Grade Complication",
           grade3_complication = "Grade 3+ Complication")
  ) %>%
  bold_labels()
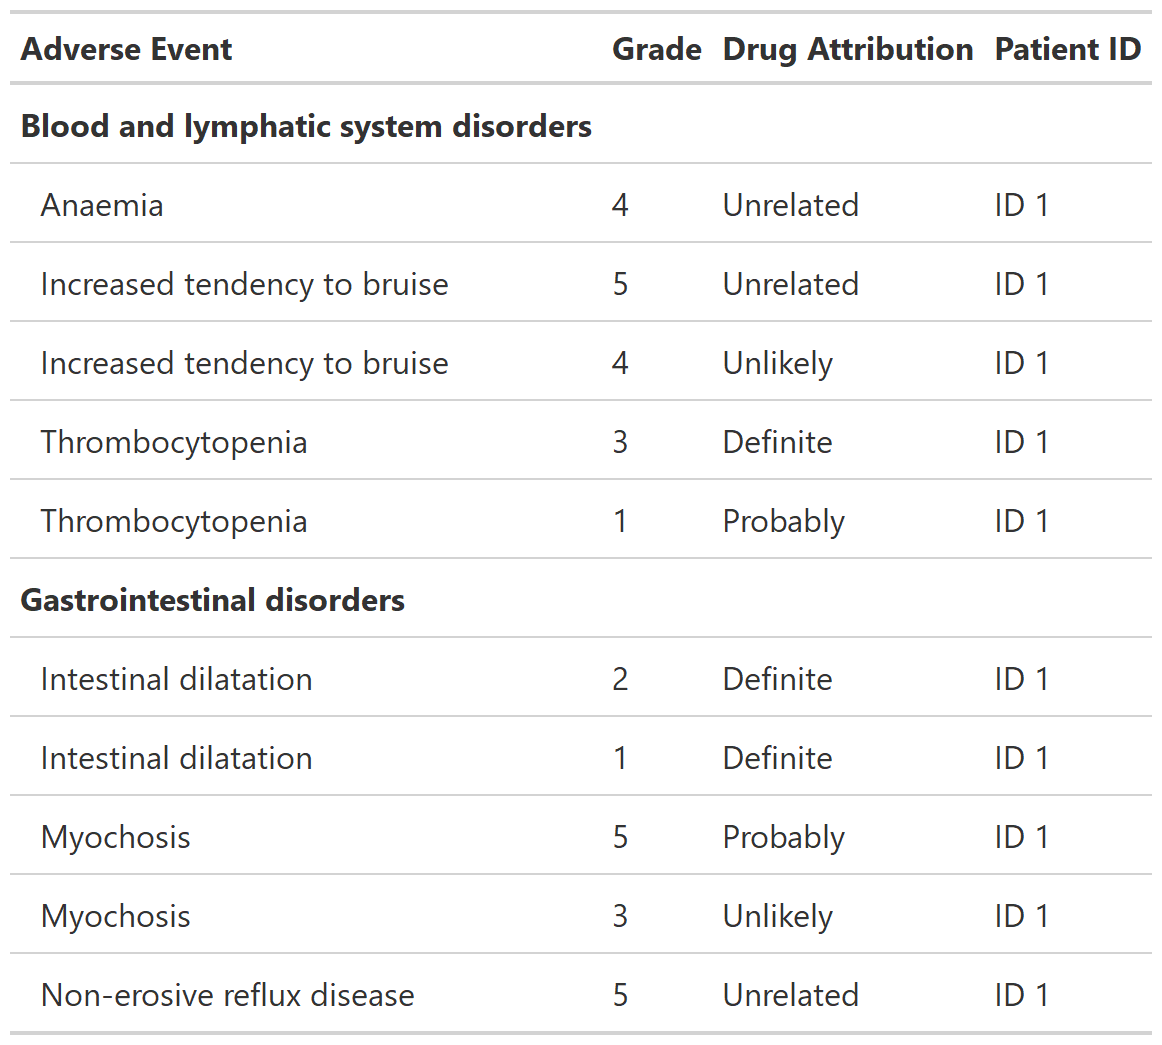
Data Listing Table
Description
Function creates a gtsummary-class listing of data. Column labels are used as column headers, when present. The listing prints observations in the order of the input data.
Usage
tbl_listing(data, group_by = NULL, bold_headers = TRUE)
Arguments
data |
a data frame |
group_by |
Single variable name indicating a grouping variable.
Default is |
bold_headers |
logical indicating whether to bold column headers.
Default is |
Value
gtsummary data listing
group_by
The grouping column and the first column in the table will be combined
and the type/class may be converted to common type/class for both columns.
However, if either the group_by= column or the first column are factors,
the factor column(s) will first be converted to character.
The groups are ordered according to the grouping variable's type (i.e., character, numeric, or factor).
Details
The purpose of tbl_listing() is to add support for printing data frames,
while taking advantage of the {gtsummary} defaults, e.g. ability to print
to most output formats, using print themes to have a common style to all
tables in a document, etc.
While the output of tbl_listing() is class 'gtsummary', these tables
are not meant to be merged with other 'gtsummary' tables with tbl_merge(),
or reporting table contents with inline_text(). The reason is that a
proper 'gtsummary' contains
additional, hidden structure
not present in the result of tbl_listing(). If you do need to report
the results of tbl_listing() in-line, it's recommended to convert
the table to a data frame, then extract the needed cell, e.g.
tbl_listing() |>
  as_tibble(col_names = FALSE) |>
  dplyr::slice(1) |>
  dplyr::pull(colname)`
Example Output
Example 1
Example 2
Examples
library(dplyr, warn.conflicts = FALSE)
tbl_listing_ex1 <-
head(df_adverse_events, n = 10) %>%
select(system_organ_class, adverse_event, grade, drug_attribution, patient_id) %>%
arrange(adverse_event, desc(grade)) %>%
tbl_listing(group_by = system_organ_class) %>%
bold_labels()
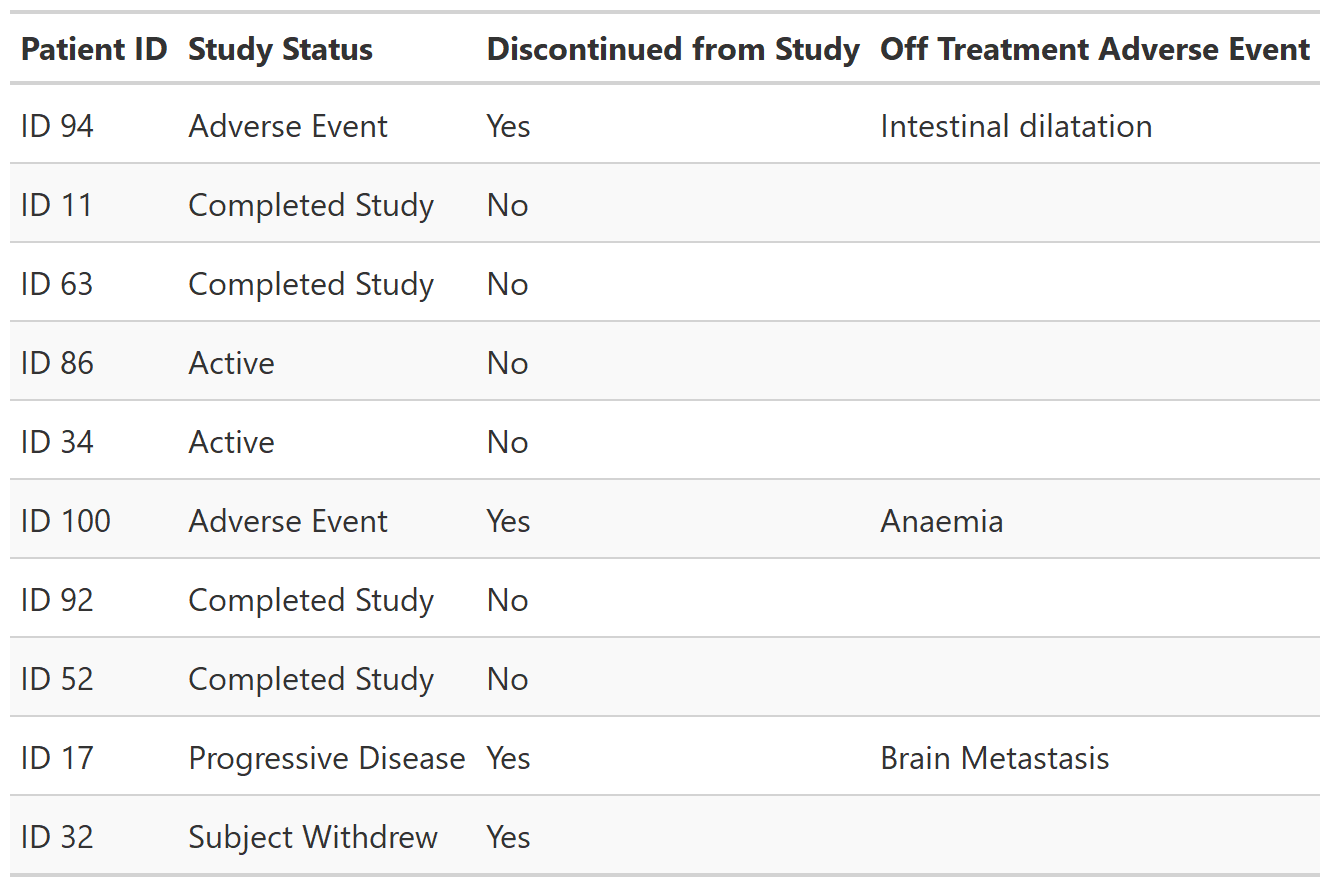
set.seed(11234)
tbl_listing_ex2 <-
df_patient_characteristics %>%
dplyr::slice_sample(n = 10) %>%
select(patient_id, status, discontinued, off_trt_ae) %>%
tbl_listing() %>%
as_gt() %>%
gt::opt_row_striping()
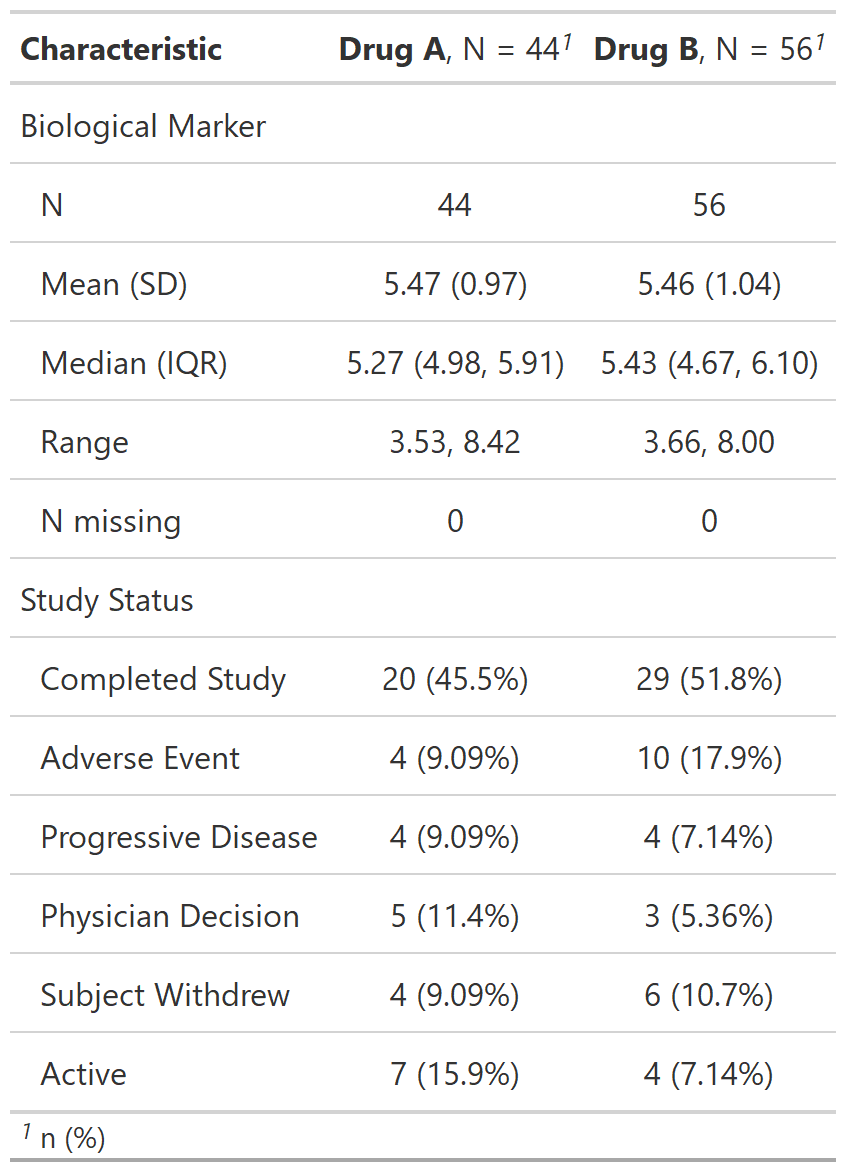
Data Summary Table
Description
Function wraps gtsummary::tbl_summary() to create a data summary
table often seen in regulatory submissions. Continuous variable summaries
are shown on multiple lines with additional summary statistics and percentages
are shown for categorical variables; precision levels estimated based on values observed.
Usage
tbl_reg_summary(
  data,
  by = NULL,
  label = NULL,
  statistic = list(all_continuous() ~ c("{N_nonmiss}", "{mean} ({sd})",
    "{median} ({p25}, {p75})", "{min}, {max}", "{N_miss}"), all_categorical() ~
    "{n} ({p}%)"),
  digits = NULL,
  type = NULL,
  value = NULL,
  missing = c("no", "yes", "ifany"),
  missing_text = "Unknown",
  missing_stat = "{N_miss}",
  sort = all_categorical(FALSE) ~ "alphanumeric",
  percent = c("column", "row", "cell"),
  include = everything()
)
Arguments
data |
( |
by |
A column name (quoted or unquoted) in |
label |
( |
statistic |
List of formulas specifying types of summary statistics to display for each variable. |
digits |
( |
type |
List of formulas specifying variable types.
Accepted values are |
value |
List of formulas specifying the value to display for dichotomous
variables. gtsummary selectors, e.g. |
missing, missing_text, missing_stat |
Arguments dictating how and if missing values are presented:
|
sort |
( |
percent |
( In rarer cases, you may need to define/override the typical denominators.
In these cases, pass an integer or a data frame. Refer to the
|
include |
( |
Value
a 'tbl_reg_summary' object
Example Output
Example 1
See Also
See gtsummary::tbl_summary() help file
See vignette for detailed tutorial
Examples
tbl_reg_summary_ex1 <-
  df_patient_characteristics %>%
  tbl_reg_summary(by = trt, include = c(marker, status))