| Type: | Package |
| Maintainer: | Steven E. Pav <shabbychef@gmail.com> |
| Version: | 0.1.2 |
| Date: | 2025-11-18 |
| License: | LGPL-3 |
| Title: | Grab Bag of 'ggplot2' Functions |
| BugReports: | https://github.com/shabbychef/ggallin/issues |
| Description: | Extra geoms and scales for 'ggplot2', including geom_cloud(), a Normal density cloud replacement for errorbars; transforms ssqrt_trans and pseudolog10_trans, which are loglike but appropriate for negative data; interp_trans() and warp_trans() which provide scale transforms based on interpolation; and an infix compose operator for scale transforms. |
| Depends: | ggplot2 (≥ 2.2.1) |
| Suggests: | knitr, testthat |
| Imports: | scales, grid |
| RoxygenNote: | 7.3.2 |
| URL: | https://github.com/shabbychef/ggallin |
| Collate: | 'geom_cloud.R' 'ggallin.R' 'transforms.R' |
| NeedsCompilation: | no |
| Packaged: | 2025-11-26 23:48:57 UTC; spav |
| Author: | Steven E. Pav  [aut, cre]
 |
| Repository: | CRAN |
| Date/Publication: | 2025-11-27 00:10:02 UTC |
Grab Bag of GGplot2 Functions.
Description
This package consists of some helper functions for working with
ggplot2: geoms, transforms, etc., with no real
unifying theme among them.
Legal Mumbo Jumbo
ggallin is distributed in the hope that it will be useful, but WITHOUT ANY WARRANTY; without even the implied warranty of MERCHANTABILITY or FITNESS FOR A PARTICULAR PURPOSE. See the GNU Lesser General Public License for more details.
Author(s)
Steven E. Pav shabbychef@gmail.com
Maintainer: Steven E. Pav shabbychef@gmail.com (ORCID)
See Also
Useful links:
Composition of scale transforms.
Description
A binary infix operator that allows one to compose together two
scale transformations. We should have that the transformation
atrans %of% btrans first applies btrans, then
applies atrans to the results. This is useful for
reversing scales, for example, along with other transformations.
Usage
atrans %of% btrans
Arguments
atrans |
a transformation object. |
btrans |
a transformation object. |
Value
a transformation object that perfroms atrans on the output of btrans.
Author(s)
Steven E. Pav shabbychef@gmail.com
See Also
Examples
set.seed(1234)
# compose transformatins with %of%:
ggplot(data.frame(x=rnorm(100),y=exp(rnorm(100,mean=-2,sd=4))),aes(x=x,y=y)) +
  geom_point() +
  scale_y_continuous(trans=scales::reverse_trans() %of% scales::log10_trans())
ggallin ggproto objects
Description
ggallin ggproto objects
geom_cloud
Description
Draw a normal uncertainty cloud as a ribbon
Draws overlapping ribbons of the same identity to create a cloud of (Gaussian) uncertainty. Similar to an errorbar geom in use, but visually less distracting (sometimes).
Usage
geom_cloud(
  mapping = NULL,
  data = NULL,
  ...,
  na.rm = TRUE,
  steps = 7,
  se_mult = 1,
  max_alpha = 1,
  inherit.aes = TRUE
)
Arguments
mapping |
Set of aesthetic mappings created by |
data |
The data to be displayed in this layer. There are three options: If A A |
... |
Other arguments passed on to
|
na.rm |
If |
steps |
The integer number of steps, or equivalently, the number of overlapping ribbons. A larger number makes a smoother cloud at the possible expense of rendering time. Values larger than around 20 are typically not necessary. |
se_mult |
The ‘multiplier’ of standard errors of the given
|
max_alpha |
The maximum alpha at the maximum density. The cloud will have alpha no greater than this value. |
inherit.aes |
If |
Details
Assumes that ymin and ymax are plotted at a
fixed number of standard errors away from y, then computes
a Gaussian density with that standard deviation, plotting a cloud
(based on geom_ribbon) with alpha proportional to the density.
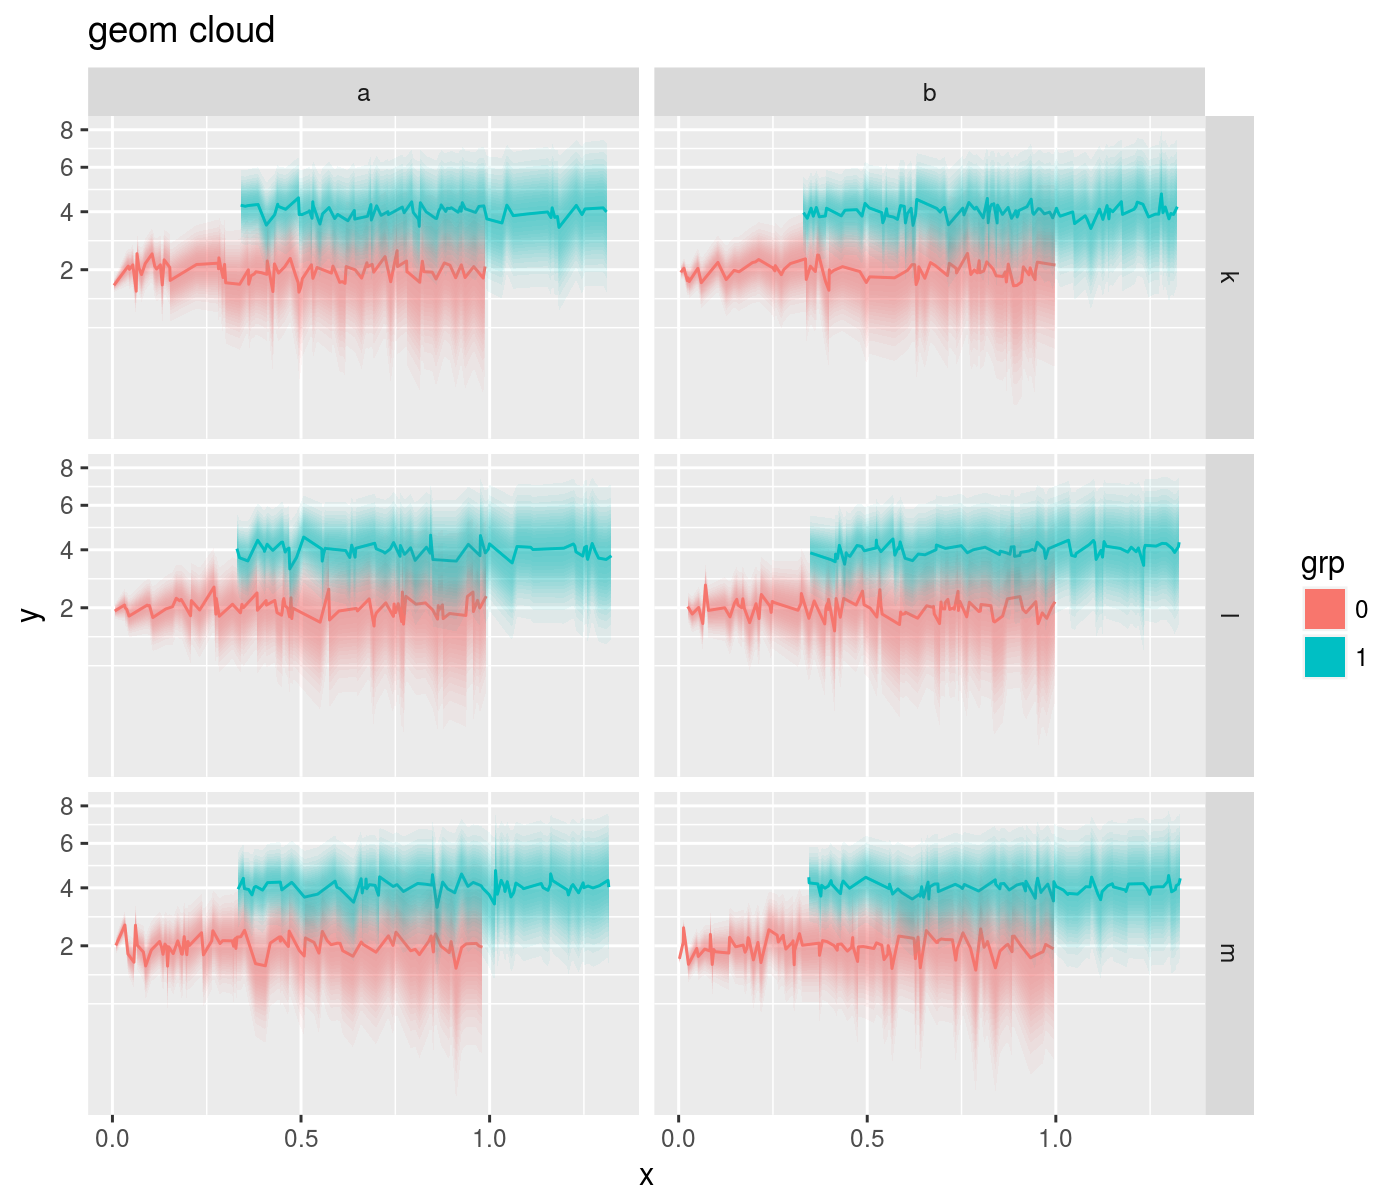
This appears as a vertical ‘cloud’ of uncertainty. In use,
this geom should be comparable to geom_errorbar.
A sample output from geom_cloud:
Aesthetics
geom_cloud understands the following aesthetics (required aesthetics
are in bold):
-
x -
y -
ymin -
ymax -
fill
Only one of ymin and ymax is strictly required.
Note
This is a thin wrapper on the geom_ribbon geom.
Author(s)
Steven E. Pav shabbychef@gmail.com
See Also
geom_ribbon: The underlying geom
Examples
set.seed(2134)
nobs <- 200
mydat <- data.frame(grp=sample(c(0,1),nobs,replace=TRUE),
  colfac=sample(letters[1:2],nobs,replace=TRUE),
  rowfac=sample(letters[10 + (1:3)],nobs,replace=TRUE))
mydat$x <- seq(0,1,length.out=nobs) + 0.33 * mydat$grp
mydat$y <- 0.25 * rnorm(nobs) + 2 * mydat$grp
mydat$grp <- factor(mydat$grp)
mydat$se  <- sqrt(mydat$x)

ggplot(mydat,aes(x=x,y=y,ymin=y-se,ymax=y+se,color=grp)) +
facet_grid(rowfac ~ colfac) +
geom_line() +
geom_errorbar() +
labs(title='uncertainty by errorbar')

ggplot(mydat,aes(x=x,y=y,ymin=y-se,ymax=y+se,fill=grp)) +
facet_grid(rowfac ~ colfac) +
geom_line() +
geom_cloud(steps=15,max_alpha=0.85) +
labs(title='uncertainty by cloudr')
News for package 'ggallin':
Description
News for package 'ggallin'
Version 0.1.2 (2025-11-26)
fixing figure width styling for CRAN
Version 0.1.1 (2017-10-01)
submit to CRAN
Interpolation based scale transforms.
Description
Interpolation based scale transformations. The user supplies x and
y (which should be monotonic increasing or decreasing in x)
to create a scale transformation based on linear interpolation.
A ‘warp’ transformation is also supported wherein the user supplies
x and w where, after sorting on x, the cumulative sum
of w are used as the y in an interpolation transformation.
Here w are the rate of increase, or ‘weights’.
Usage
interp_trans(x=NULL,y=NULL,data=NULL,na.rm=TRUE,breaks=NULL,format=NULL)

warp_trans(x=NULL,w=NULL,data=NULL,na.rm=TRUE,breaks=NULL,format=NULL)
Arguments
x |
the |
y |
the |
data |
A |
na.rm |
If |
breaks |
default breaks function for this transformation. The breaks function is applied to the un-transformed data. |
format |
default format for this transformation. The format is applied to breaks generated on the un-transformed data. |
w |
the |
Value
A scale transformation object.
Author(s)
Steven E. Pav shabbychef@gmail.com
See Also
Examples
set.seed(1234)
ggplot(data.frame(x=rnorm(100),y=runif(100)),aes(x=x,y=y)) +
  geom_point() +
  scale_x_continuous(trans=interp_trans(x=seq(-10,10,by=1),y=cumsum(runif(21))))

set.seed(1234)
ggplot(data.frame(x=rnorm(100),y=runif(100)),aes(x=x,y=y)) +
  geom_point() +
  scale_x_continuous(trans=warp_trans(x=seq(-10,10,by=1),w=runif(21)))

# equivalently:
set.seed(1234)
ggplot(data.frame(x=rnorm(100),y=runif(100)),aes(x=x,y=y)) +
  geom_point() +
  scale_x_continuous(trans=warp_trans(data=data.frame(x=seq(-10,10,by=1),w=runif(21))))

# this is like trans_sqrt:
set.seed(1234)
myx <- seq(0,5,by=0.01)
ggplot(data.frame(x=rnorm(100),y=runif(100)),aes(x=x,y=y)) +
  geom_point() +
  scale_y_continuous(trans=interp_trans(x=myx,y=sqrt(myx)))
Various scale transforms.
Description
Various scale transformations.
Usage
ssqrt_trans

pseudolog10_trans
Format
An object of class transform of length 9.
An object of class transform of length 9.
Details
The available transforms:
-
ssqrt_transa signed square root transform appropriate for negative or positive numbers. -
pseudolog10_transanasinhtransformation, which is like a logarithm, but appropriate for negative or positive numbers. This transformation was taken from the Win Vector blog, https://win-vector.com/2012/03/01/modeling-trick-the-signed-pseudo-logarithm/.
Value
A scale transformation object.
Author(s)
Steven E. Pav shabbychef@gmail.com
See Also
https://win-vector.com/2012/03/01/modeling-trick-the-signed-pseudo-logarithm/
Examples
set.seed(1234)
ggplot(data.frame(x=rnorm(100),y=runif(100)),aes(x=x,y=y)) +
  geom_point() +
  scale_x_continuous(trans=ssqrt_trans)

set.seed(1234)
ggplot(data.frame(x=rnorm(100),y=runif(100)),aes(x=x,y=y)) +
  geom_point() +
  scale_x_continuous(trans=pseudolog10_trans)