| Type: | Package |
| Title: | Creates Analysis Results Datasets |
| Version: | 0.1.3 |
| Maintainer: | David Bosak <dbosak01@gmail.com> |
| Description: | Contains functions to help create an Analysis Results Dataset. The dataset follows industry recommended structure. The dataset can be created in multiple passes, using different data frames as input. Analysis Results Datasets are used in the pharmaceutical and biotech industries to capture analysis in a common tabular data structure. |
| License: | CC0 |
| Encoding: | UTF-8 |
| URL: | https://ards.r-sassy.org, https://github.com/dbosak01/ards |
| BugReports: | https://github.com/dbosak01/ards/issues |
| Depends: | R (≥ 4.1) |
| Suggests: | dplyr, tidyr, tibble, testthat (≥ 3.0.0), knitr, rmarkdown |
| Config/testthat/edition: | 3 |
| RoxygenNote: | 7.3.2 |
| VignetteBuilder: | knitr |
| NeedsCompilation: | no |
| Packaged: | 2025-10-24 01:44:55 UTC; dbosa |
| Author: | David Bosak [aut, cre], Kevin Kramer [ctb], Jack Fuller [ctb], Matt Baldwin [ctb] |
| Repository: | CRAN |
| Date/Publication: | 2025-10-24 02:20:02 UTC |
ards: A package for creating Analysis Results Datasets
Description
An Analysis Results Dataset (ARDS) is commonly used in the pharma-biotech industry to capture the results of an analysis in a tabular data structure. The ards package helps create the ARDS. ards functions can be called from inside a report program or a data preparation program. The functions use a "bucketing" approach, whereby data can be added to the ARDS in multiple calls and from multiple intermediate data sets.
Details
The ards package allows you to easily create an ARDS dataset in a standard clinical reporting or data preparation program. The ards package contains only three functions, and each will be used to create the ARDS dataset. The functions will be called in the following order, and for the described purpose:
-
init_ards: Initialize an ARDS dataset -
add_ards: Add data to an ARDS dataset -
get_ards: Extract the completed ARDS
Click on the links above for more information about each function.
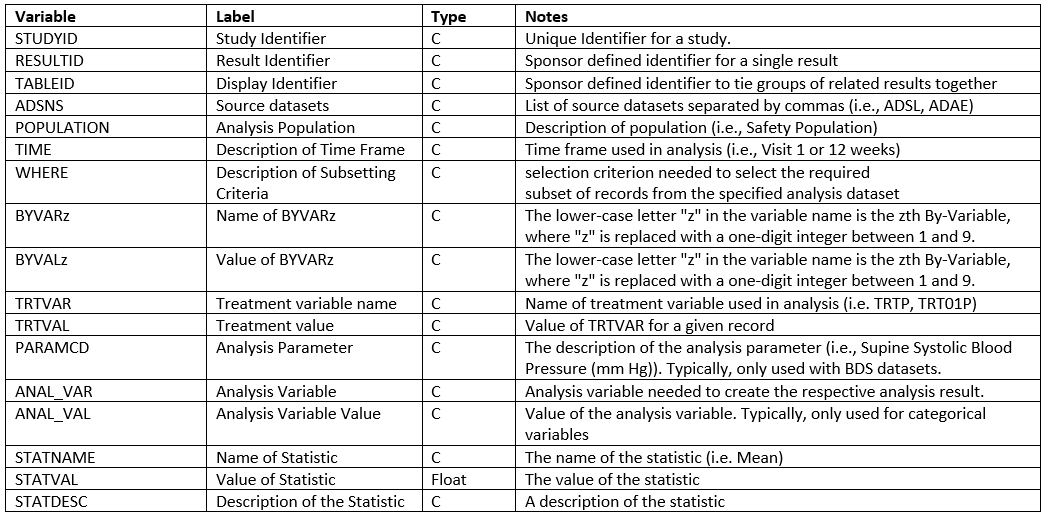
The following figure describes the structure of the ARDS dataset. This
structure is recommended by CDISC.
Author(s)
Maintainer: David Bosak dbosak01@gmail.com
Other contributors:
Kevin Kramer kkrame02@amgen.com [contributor]
Jack Fuller jacfulle@amgen.com [contributor]
Matt Baldwin mbaldw01@amgen.com [contributor]
See Also
Useful links:
Report bugs at https://github.com/dbosak01/ards/issues
Adds data to an Analysis Results Dataset
Description
The add_ards function dumps data from an input analysis
dataset
to the ARDS dataset. The function is designed to be pipe-friendly, and will
return the input dataset unaltered. The parameters on the function
define how to extract the desired data from the analysis dataset.
The "statvars" parameter defines which columns contain desired
analysis results. The values in these columns will be used to populate the
"statval" variable in the output dataset. Other parameters are used to
define identifying information for the statistics values, and are optional.
The add_ards function should be called immediately after any
calculations, while the analysis results are still in numeric form. This
recommendation is to ensure that the ARDS will contain full precision of the
analysis values. Once the analysis values are dumped into the ARDS, you
may proceed to transform and format your analysis data, without affecting
the values captured in the ARDS.
Usage
add_ards(
  data,
  statvars,
  statdesc = NULL,
  byvars = NULL,
  trtvar = NULL,
  paramcd = NULL,
  anal_var = NULL,
  anal_val = NULL
)
Arguments
data |
The input data to create analysis results for. This parameter is required. |
statvars |
A vector of column names that identify the desired results. Statvar columns must be numeric. This parameter is required. |
statdesc |
A vector of values or a column name that identifies a description for each statvar. If passed as a vector of values, the number of values should correspond to the number of 'statvar' variables. |
byvars |
A vector of column names to use for by variables. |
trtvar |
A column name to use for the treatment variable. |
paramcd |
A character string that describes the analysis parameter code or column name that contains the parameter code. If supplied as a column name, the function will populate the 'paramcd' column in the ARDS with the value of the 'paramcd' column. |
anal_var |
A column name for the analysis variable or a string that identifies the analysis variable. |
anal_val |
The analysis variable value. Can be identified by a column name or a vector of values. By default, the analysis values will be taken from the values of the variable passed in 'anal_var'. This parameter exists so that you may pass in the values from a different variable, if desired. |
Value
The input data frame, unaltered.
See Also
Other ards:
get_ards(),
init_ards(),
restore_ards()
Examples
library(ards)
library(dplyr)

# Initialize the ARDS
init_ards(studyid = "MTCARS",
          tableid = "01", adsns = "mtcars",
          population = "all cars",
          time = "1973")

# Perform analysis on MPG
# - Add to ARDS from within continuous variable pipeline
mpgdf <- mtcars |>
  select(cyl, mpg) |>
  group_by(cyl) |>
  summarize(n = n(),
            mean = mean(mpg),
            std = sd(mpg),
            min = min(mpg),
            max = max(mpg)) |>
  add_ards(statvars = c("n", "mean", "std", "min", "max"),
         anal_var = "mpg", trtvar = "cyl")

# Perform analysis on GEAR
# - Add to ARDS from within categorical variable pipeline
geardf <- mtcars |>
  mutate(denom = n()) |>
  select(cyl, gear, denom) |>
  group_by(cyl, gear) |>
  summarize(cnt = n(),
            denom = max(denom)) |>
  mutate(pct = cnt / denom * 100) |>
  add_ards(statvars = c("cnt", "pct", "denom"),
         anal_var = "gear", trtvar = "cyl")

# Get the ARDS
ards <- get_ards()

# Uncomment to view ards
# View(ards)
Returns the current Analysis Results Dataset
Description
The get_ards function returns the current state
of the Analysis Results Dataset (ARDS) as an R data frame.
This data frame may be saved to disk, saved in
a database, or examined from code. The function takes no parameters.
Usage
get_ards()
Value
A data frame of the current analysis results.
See Also
Other ards:
add_ards(),
init_ards(),
restore_ards()
Examples
library(ards)
library(dplyr)

# Initialize the ARDS
# - These values will be common through the dataset
init_ards(studyid = "IRIS",
          tableid = "01", adsns = "iris",
          population = "all flowers",
          time = "1973")

# Perform analysis on Petal.Length
# - Using Species as a by-group
analdf1 <- iris |>
  select(Petal.Length, Species) |>
  group_by(Species) |>
  summarize(n = n(),
            mean = mean(Petal.Length),
            std = sd(Petal.Length),
            min = min(Petal.Length),
            max = max(Petal.Length)) |>
  add_ards(statvars = c("n", "mean", "std", "min", "max"),
           statdesc = c("Count", "Mean", "STD", "Minimum", "Maximum"),
           anal_var = "Petal.Length", trtvar = "Species")

# Perform analysis on Petal.Width
# - Using Species as a by-group
analdf2 <- iris |>
  select(Petal.Width, Species) |>
  group_by(Species) |>
  summarize(n = n(),
            mean = mean(Petal.Width),
            std = sd(Petal.Width),
            min = min(Petal.Width),
            max = max(Petal.Width)) |>
  add_ards(statvars = c("n", "mean", "std", "min", "max"),
           statdesc = c("Count", "Mean", "STD", "Minimum", "Maximum"),
           anal_var = "Petal.Width", trtvar = "Species")

# Get the ARDS
ards <- get_ards()

# Uncomment to view ards
# View(ards)
Initialize the Analysis Results Dataset
Description
A function to initialize the Analysis Results Dataset (ARDS).
This function will
first create a data template in the desired structure, and then
populate common values across the dataset from that template.
These common values will be
repeated on each row of the analysis data frame for subsequent inserts
from the add_ards function.
Usage
init_ards(
  studyid = NA,
  tableid = NA,
  adsns = NA,
  population = NA,
  time = NA,
  where = NA,
  reset = TRUE
)
Arguments
studyid |
The study for which the analysis was performed. This parameter is optional. |
tableid |
A table identifier to use for the results. This value identifies the table within the study. Optional string value. |
adsns |
A vector of source dataset names. This parameter is used to identify the input data for the analysis. This parameter is optional. |
population |
A description of the analysis population. This parameter is used to identify the population for analysis. This parameter is optional. |
time |
A optional description of the time frame used in the analysis. For example, in a clinical study, the "time" value may identify the visit on which the analysis is based. |
where |
An optional description of the criteria used to subset the data for analysis. |
reset |
If true, clears out the existing ARDS dataset and replaces with
an empty template. Otherwise, just assign new parameter values to the
existing template. The default
value is TRUE, meaning the ARDS in memory will be cleared every time
|
Value
The initialized analysis dataset.
See Also
Other ards:
add_ards(),
get_ards(),
restore_ards()
Examples
library(ards)
library(dplyr)

# Initialize the ARDS
# - These values will be common through the dataset
init_ards(studyid = "MTCARS",
          tableid = "01", adsns = "mtcars",
          population = "all cars",
          time = "1973")

# Perform analysis on MPG
# - Using cylinders as a by-group
analdf <- mtcars |>
  select(cyl, mpg) |>
  group_by(cyl) |>
  summarize(n = n(),
            mean = mean(mpg),
            std = sd(mpg),
            min = min(mpg),
            max = max(mpg))

# View analysis data
analdf
#     cyl     n  mean   std   min   max
#   <dbl> <int> <dbl> <dbl> <dbl> <dbl>
# 1     4    11  26.7  4.51  21.4  33.9
# 2     6     7  19.7  1.45  17.8  21.4
# 3     8    14  15.1  2.56  10.4  19.2

# Add analysis data to ARDS
# - These values will be unique per row
add_ards(analdf,
         statvars = c("n", "mean", "std", "min", "max"),
         anal_var = "mpg", trtvar = "cyl")


# Get the ARDS
ards <- get_ards()

# Uncomment to view ards
# View(ards)
Restore an ARDS dataset
Description
The restore_ards function restores the ARDS data to wide format.
The wide data can then be used for reporting.
Usage
restore_ards(data, init_vars = FALSE, anal_var = "anal_var")
Arguments
data |
The input dataset to restore. The input dataset should correspond
to the CDISC ARDS structure, such as that created by |
init_vars |
Whether or not to keep the initialization variables on
the restored data frames. Default is FALSE. The initialization variables
include "studyid", "tableid", "adsns", "population", "time", and "where".
To keep these variables on the restored data frames, set |
anal_var |
The name to use for the analysis variable column. This column is retained to positively identify the data frame. The default name is is "anal_var". If you need a different name for this column, pass the name as a quoted string. To eliminate the column entirely, pass a NULL value to this parameter. |
Details
The init_ards, add_ards, and get_ards
functions take data in wide format, and convert it to narrow format. The
restore_ards function converts the narrow ARDS data back to wide format.
Wide format means there is a column for each statistic. Narrow format means all statistics are in a single column.
Because each analysis variable can have any number of statistics, when
converting from narrow to wide, the resulting data frames can have different
numbers of colums and different column names. Therefore, the restore_ards
function returns a list of data frames, one for each analysis variable.
For each data frame, the statistics will each be in a separate column, named according to the original statistic variable name. The label of the statistics columns will be any value passed to the statistic description ("statdesc") for that analysis variable.
By default, the columns populated by init_ards will not be
returned. These columns can be returned by setting the "init_vars" parameter
to TRUE.
Once the ARDS data is restored and the statistics are back in separate columns, it will be easy to create a report, figure, or other output.
Value
A list of data frames, transposed back into wide format. The list will have one or more items, distinguished by the analysis variable. The list item name will correspond to the name of the analysis variable.
See Also
Other ards:
add_ards(),
get_ards(),
init_ards()
Examples
library(ards)
library(dplyr)

# Initialize the ARDS
# - These values will be common through the dataset
init_ards(studyid = "IRIS",
          tableid = "01", adsns = "iris",
          population = "all flowers",
          time = "1973")

# Perform analysis on Petal.Length
# - Using Species as a by-group
analdf1 <- iris |>
  select(Petal.Length, Species) |>
  group_by(Species) |>
  summarize(n = n(),
            mean = mean(Petal.Length),
            std = sd(Petal.Length),
            min = min(Petal.Length),
            max = max(Petal.Length)) |>
  add_ards(statvars = c("n", "mean", "std", "min", "max"),
           statdesc = c("Count", "Mean", "STD", "Minimum", "Maximum"),
           anal_var = "Petal.Length", trtvar = "Species")

# Perform analysis on Petal.Width
# - Using Species as a by-group
analdf2 <- iris |>
  select(Petal.Width, Species) |>
  group_by(Species) |>
  summarize(n = n(),
            mean = mean(Petal.Width),
            std = sd(Petal.Width),
            min = min(Petal.Width),
            max = max(Petal.Width)) |>
  add_ards(statvars = c("n", "mean", "std", "min", "max"),
           statdesc = c("Count", "Mean", "STD", "Minimum", "Maximum"),
           anal_var = "Petal.Width", trtvar = "Species")

# Get the ARDS
ards <- get_ards()

# Convert back to wide format
res <- restore_ards(ards)

# View list names
print(names(res))
# [1] "Petal.Length" "Petal.Width"

# Pull out Petal.Length
r1 <- res$Petal.Length

# View column names on Petal.Length
print(names(r1))
# [1] "Species"  "anal_var" "n"        "mean"     "std"      "min"      "max"

# View stat data on Petal.Length
print(r1)
#      Species     anal_var  n  mean       std min max
# 1     setosa Petal.Length 50 1.462 0.1736640 1.0 1.9
# 2 versicolor Petal.Length 50 4.260 0.4699110 3.0 5.1
# 3  virginica Petal.Length 50 5.552 0.5518947 4.5 6.9

# Uncomment to view restored datasets
# View(res$Petal.Length)
# View(res$Petal.Width)